Executive summary
For workshops that we as librarians independently schedule,
for most topics, virtual and hybrid workshops have higher attendance (6.4) than in-person (4.3) in the last two calendar years (2023-2025)
a few topics have higher attendance (15) than others regardless of format
more detailed event descriptions seem to get higher attendance than title only descriptions
Otherwise, workshops requested by someone either standalone (such as by a department or research group) or within a course have the highest attendances.
Per-workshop attendance
Most recent two years (2023-2025)
Scheduled (not requested, not in a class) workshops
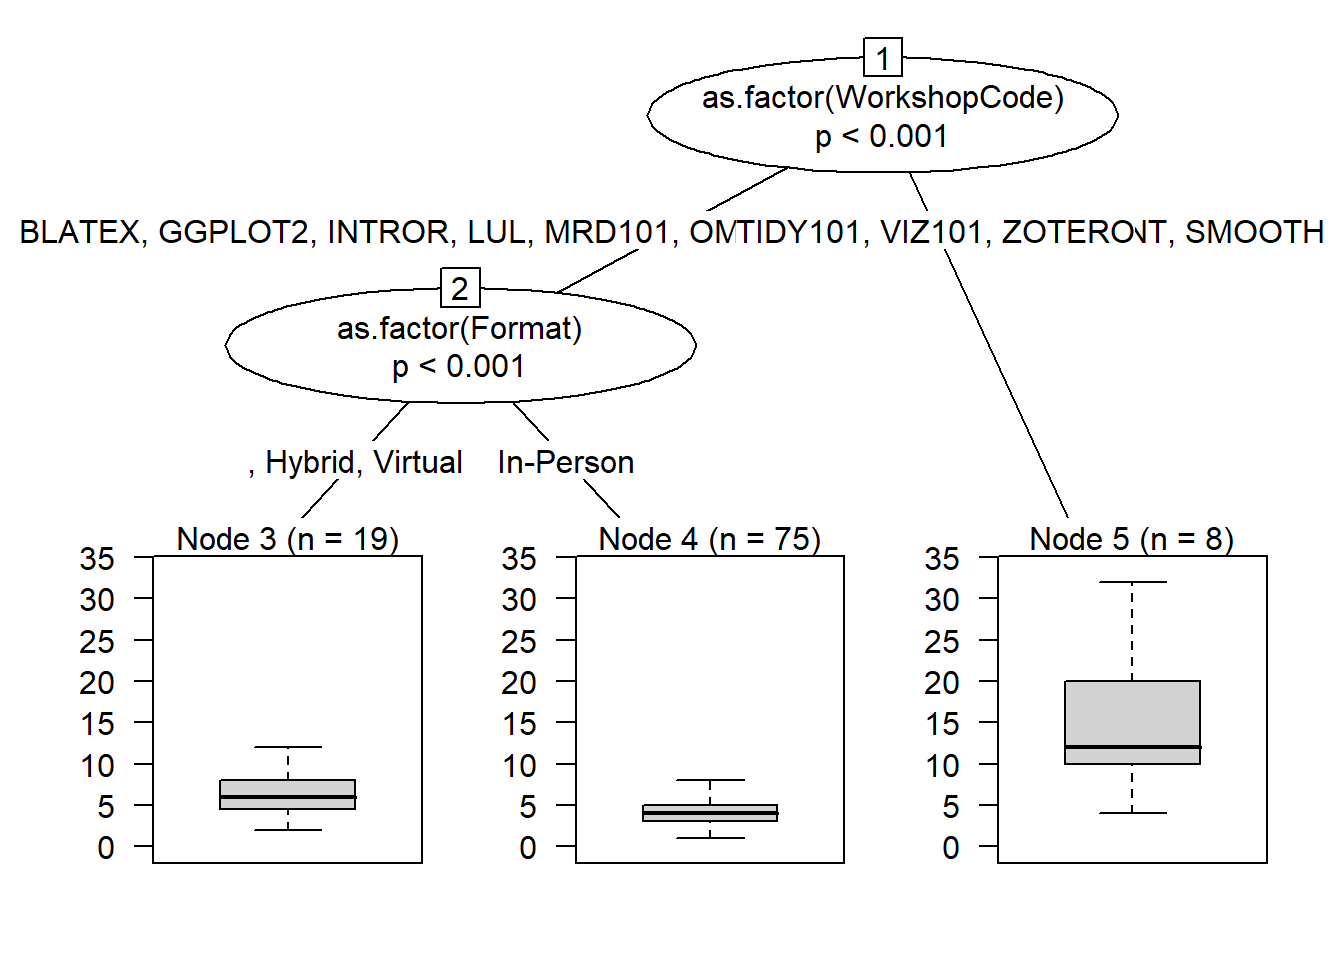
This statistical analysis addresses what factors influence attendance in librarian-scheduled (non-course, not-patron requested) frequently offered (more than two times ever) workshops in 2023-2025.
The variables significantly influencing attendance are
topic
- A few workshops (TIDY101, VIZ101, ZOTERO) have an average of 15.0 attendees regardless of format
format
- Remaining workshops have slightly higher (virtual and hybrid with an average of 6.4) or lower (4.3) attendance based on format
All variables studied were:
workshop topic
format (in person vs virtual vs hybrid)
calendar year (starts in January): no significant splits
semester (spring, summer, or fall): no significant splits
multi-day vs single day scheduling: no significant splits
Model formula:
Total.Attendees ~ as.factor(Format) + as.factor(year) + as.factor(WorkshopCode) +
    as.factor(Is.this.visit.part.of.a.series.) + as.factor(Semester)

Fitted party:
[1] root
|   [2] as.factor(WorkshopCode) in BLATEX, GGPLOT2, INTROR, LUL, MRD101, OMEKA, OSF1HOUR, PRESENT, SMOOTH
|   |   [3] as.factor(Format) in , Hybrid, Virtual: 6.421 (n = 19, err = 148.6)
|   |   [4] as.factor(Format) in In-Person: 4.253 (n = 75, err = 218.2)
|   [5] as.factor(WorkshopCode) in TIDY101, VIZ101, ZOTERO: 15.000 (n = 8, err = 602.0)

Number of inner nodes:    2
Number of terminal nodes: 3
[1] "Scheduled workshops from 2023 to 2025 (last two calendar years)"
All workshops (including visits to classes and requested workshops)
When we examine all workshops over all dates with data (included on-request visits to classes and on-request workshops, and uncommonly offered topics), we add the following variables:
workshop was in a course
requested or not
We removed workshop topic as a variable to split on, because some topics were only offered once and so that variable is a less informative split.
Overall, requested and within-course workshops and hybrid/virtual workshops are more highly attended
Early years (2018-2019, 2021) are highest attended for non-course events regardless of request or format. Spring and Fall semesters had differing attendance in those early years, but not in more recent years.
In the remaining years, mainly more recent ones (2020, 2022-2025), requested events are highest (11), followed by non-requested hybrid or virtual events (7.4), with non-requested in person events lowest (4.9).
Model formula:
Total.Attendees ~ as.factor(Format) + as.factor(year) + as.factor(Semester) +
    as.factor(Is.Course) + as.factor(Requested.)

Fitted party:
[1] root
|   [2] as.factor(Is.Course) in Not a course
|   |   [3] as.factor(year) in 2018, 2019, 2021
|   |   |   [4] as.factor(Semester) in Fall: 11.000 (n = 42, err = 3220.0)
|   |   |   [5] as.factor(Semester) in Spring, Summer: 12.333 (n = 39, err = 3474.7)
|   |   [6] as.factor(year) in 2020, 2022, 2023, 2024, 2025
|   |   |   [7] as.factor(Requested.) in No, Unknown
|   |   |   |   [8] as.factor(Format) in , Hybrid, Virtual: 7.440 (n = 84, err = 2210.7)
|   |   |   |   [9] as.factor(Format) in In-Person: 4.882 (n = 102, err = 612.6)
|   |   |   [10] as.factor(Requested.) in Yes: 11.000 (n = 28, err = 4884.0)
|   [11] as.factor(Is.Course) in Within a course: 15.627 (n = 83, err = 6167.4)

Number of inner nodes:    5
Number of terminal nodes: 6
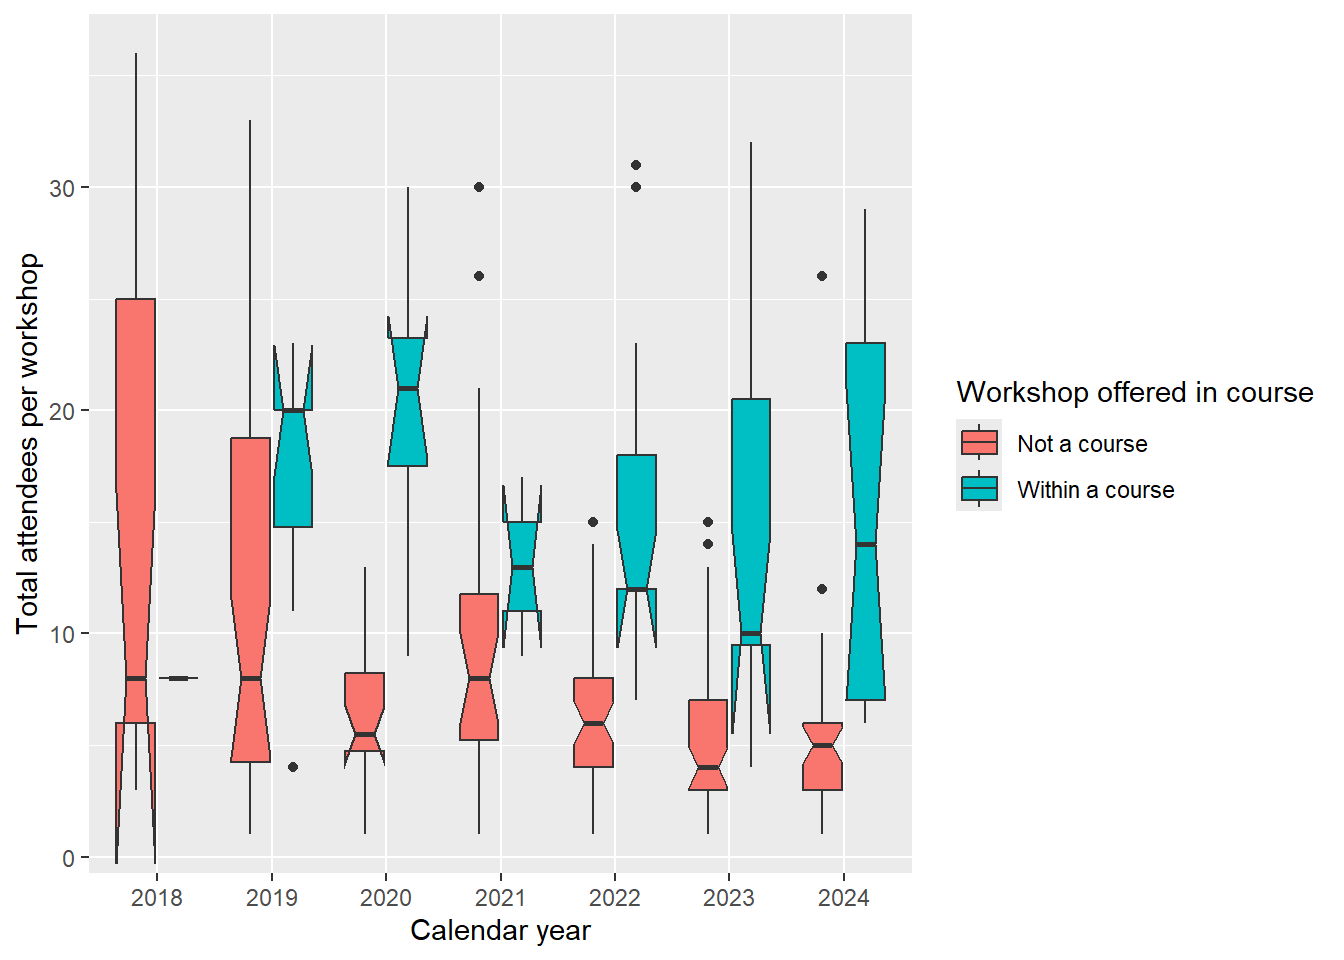
Workshop attendance over time
The median number of people at each scheduled workshop has declined slightly per calendar year after 2022 and appears to be stable now as of late 2025. Workshop attendance at courses is higher, presumably because most classes have to reach a certain enrollment to “make”.
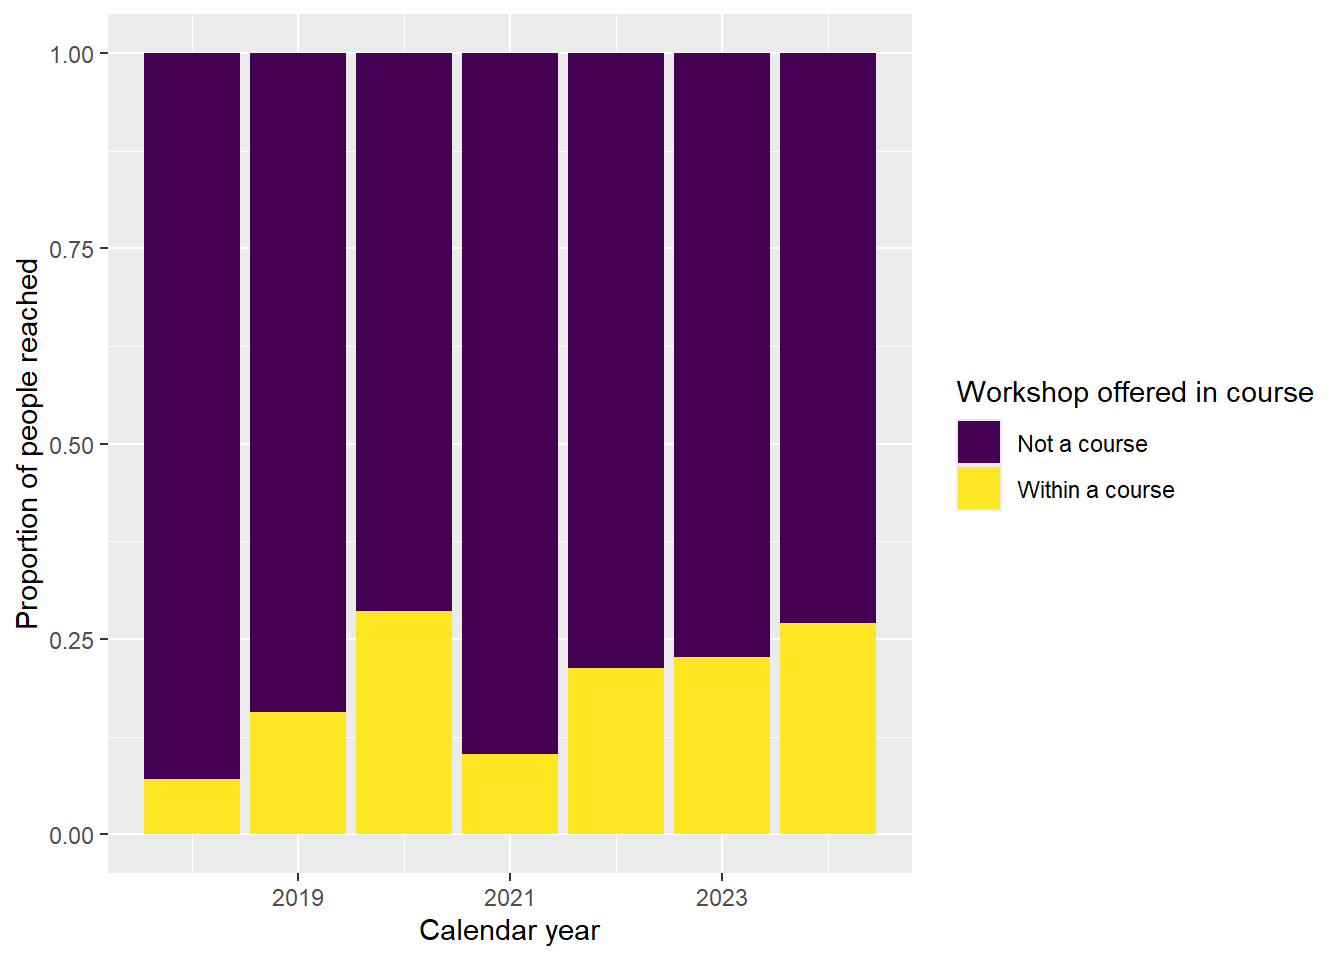
Total people reached
The total number of people reached has no strong trends between 2021-2024 and has increased in 2025 compared to 2024.
# A tibble: 3 × 9
  Is.Course       `2018` `2019` `2020` `2021` `2022` `2023` `2024` `2025`
  <chr>            <int>  <int>  <int>  <int>  <int>  <int>  <int>  <int>
1 Not a course       190    496    128    257    317    293    269    424
2 Within a course      8    134    162     39    205    233    233    283
3 Total              198    630    290    296    522    526    502    707
When we examined whether proportionately we reach more people in or out of courses, we seem to have stabilized since 2022 at around one-third of our learners reached being in courses. About a quarter of our workshops are now conducted in classes (Chapter 1) but these reach about a third of our learners, suggesting these are a higher impact way to reach more people per staff time.